The 12 Best Tools for Creating Infographics in 2026

Discover the 12 best tools for creating infographics, from drag-and-drop editors to AI-powered automation. Find the right tool for your brand today.
Capturing your audience's attention requires more than just words. Infographics are a powerful medium for transforming complex data and ideas into engaging, shareable, and easily digestible visual stories. They can establish your brand as an authority, drive traffic, and make your message stick. But creating them doesn't have to be a complex, time-consuming process reserved for professional designers with expensive software.
Whether you're a small business owner, a busy social media manager, or part of a marketing agency, the right software makes all the difference. This comprehensive guide explores the best tools for creating infographics, breaking down their unique strengths and ideal use cases. We cover everything from fully automated AI agents like Postbae, perfect for social-media-first visuals, to versatile manual design suites such as Canva and specialized data visualization platforms. To truly transform data into stunning visuals, it's essential to understand the fundamental design principles that make any visual content stand out, and the right tool will help you apply them effectively.
Our goal is to help you find the perfect platform for your specific workflow, budget, and creative goals. Each option in this list includes a detailed analysis of its features, pricing, pros, and cons, complete with screenshots and direct links. We will equip you with the insights needed to select the best tool to turn your information into impactful visual content efficiently.
1. Postbae
Postbae represents a significant evolution in social media content creation, positioning itself as an AI-powered agent designed for complete automation. Instead of providing a canvas and tools for manual design, Postbae works autonomously in the background to generate professional, ready-to-post visual graphics. It is specifically engineered for small businesses, agencies, and content creators who need a consistent stream of high-quality, authority-building content for platforms like Instagram, Facebook, and LinkedIn without dedicating hours to design.
This tool is one of the best for creating infographics for social media because it automates the entire multidisciplinary process. The AI handles everything from ideation and research to copywriting and graphic design, intelligently selecting the best format for the content, such as a multi-slide carousel, a listicle, or an educational infographic.
Key Differentiator: Autonomous Visual Creation
The core strength of Postbae is its "no prompts needed" workflow. Once set up, the AI agent identifies relevant topics for your industry and automatically produces complete visual assets. This goes far beyond simple text generation; Postbae creates the actual graphics, populated with industry-specific tips, insights, and data. This makes it a powerful tool for establishing expertise and educating your audience consistently.
Practical Use Cases & Features
Best For: Social media managers, small business owners, and marketing agencies needing to produce educational infographics and authority-building content at scale without manual effort.
Standout Features:
Fully Autonomous Generation: Creates complete visual social media posts without requiring user prompts.
Format Variety: Intelligently produces multi-slide carousels, TikTok slideshows, and educational infographics.
Full Editing Control: While automated, every element of a generated graphic is fully customizable, giving you final creative control.
Authority-Building Focus: Excels at creating industry-specific educational content that positions you as an expert in your field.
Pricing and Access
Postbae offers its powerful automation starting at an accessible price point of $30 per month. This tier provides a cost-effective solution for businesses aiming to achieve the output of a dedicated social media manager for a fraction of the cost.
- Website: https://postbae.com
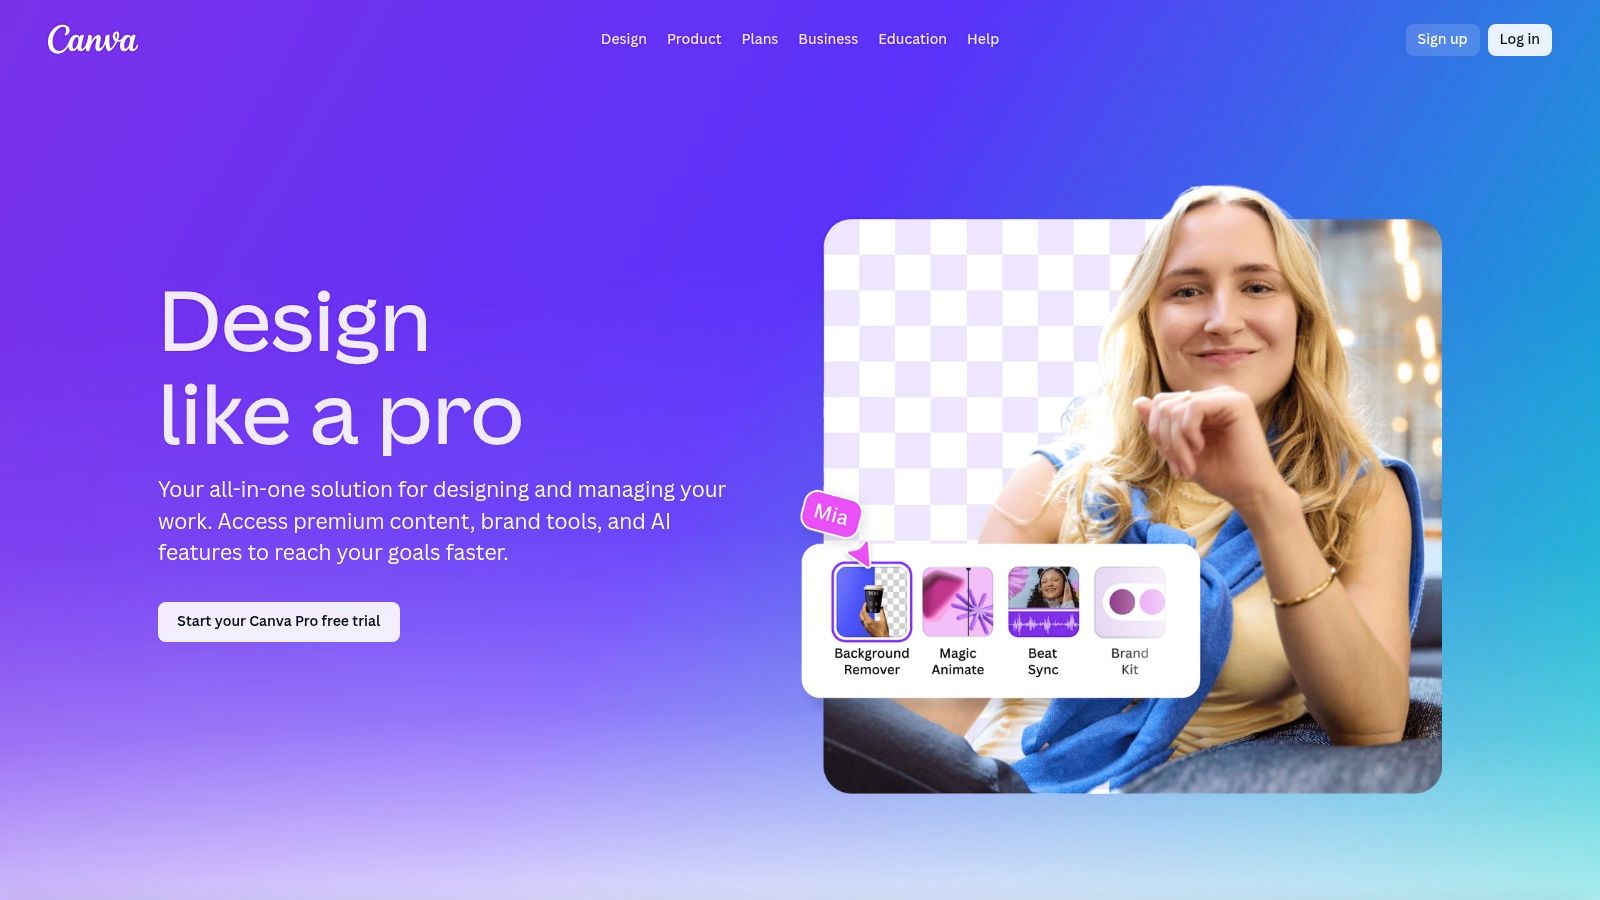
2. Canva
A household name in the design world, Canva has established itself as one of the best tools for creating infographics, especially for those without a formal design background. Its intuitive, browser-based drag-and-drop editor makes it incredibly simple to produce high-quality visuals quickly. From social media managers to marketing agencies, users of all skill levels can leverage its extensive library to create compelling visual narratives.
Canva's key strength lies in its sheer volume of resources. The platform offers thousands of professionally designed infographic templates that serve as a launchpad for any project. Whether you're visualizing survey data, creating a step-by-step guide, or designing a timeline, there's a template ready to be customized. This massive library, combined with over 100 million stock assets on paid plans, ensures you have everything you need in one place.
Key Features and Pricing
Canva's feature set is designed for both speed and brand consistency. The Brand Kit allows teams to preload logos, fonts, and color palettes, ensuring every infographic adheres to brand guidelines. Integrated AI tools, part of its "Magic Studio," can assist with writing, generating images, and even animating elements to speed up production.
Free Plan: Includes thousands of free templates and design assets, plus 5GB of cloud storage.
Canva Pro: Unlocks the entire library of premium templates and assets, Brand Kit, Magic Resize, and advanced AI features.
Canva for Teams: Adds collaboration tools, team reports, and centralized brand management controls.
Pros and Cons
While extremely powerful, Canva is best suited for certain use cases. It excels at creating visually appealing, template-based infographics for social media, presentations, and blog posts. Its ease of use and rapid onboarding make it a go-to for teams needing to scale content creation without a steep learning curve.
Pros:
Exceptionally user-friendly interface for non-designers.
Vast ecosystem of templates and stock assets.
Strong collaboration features for team-based workflows.
Cons:
Advanced data visualizations can feel limited compared to specialized charting tools.
Pricing tiers for teams have evolved, so it's wise to confirm current costs.
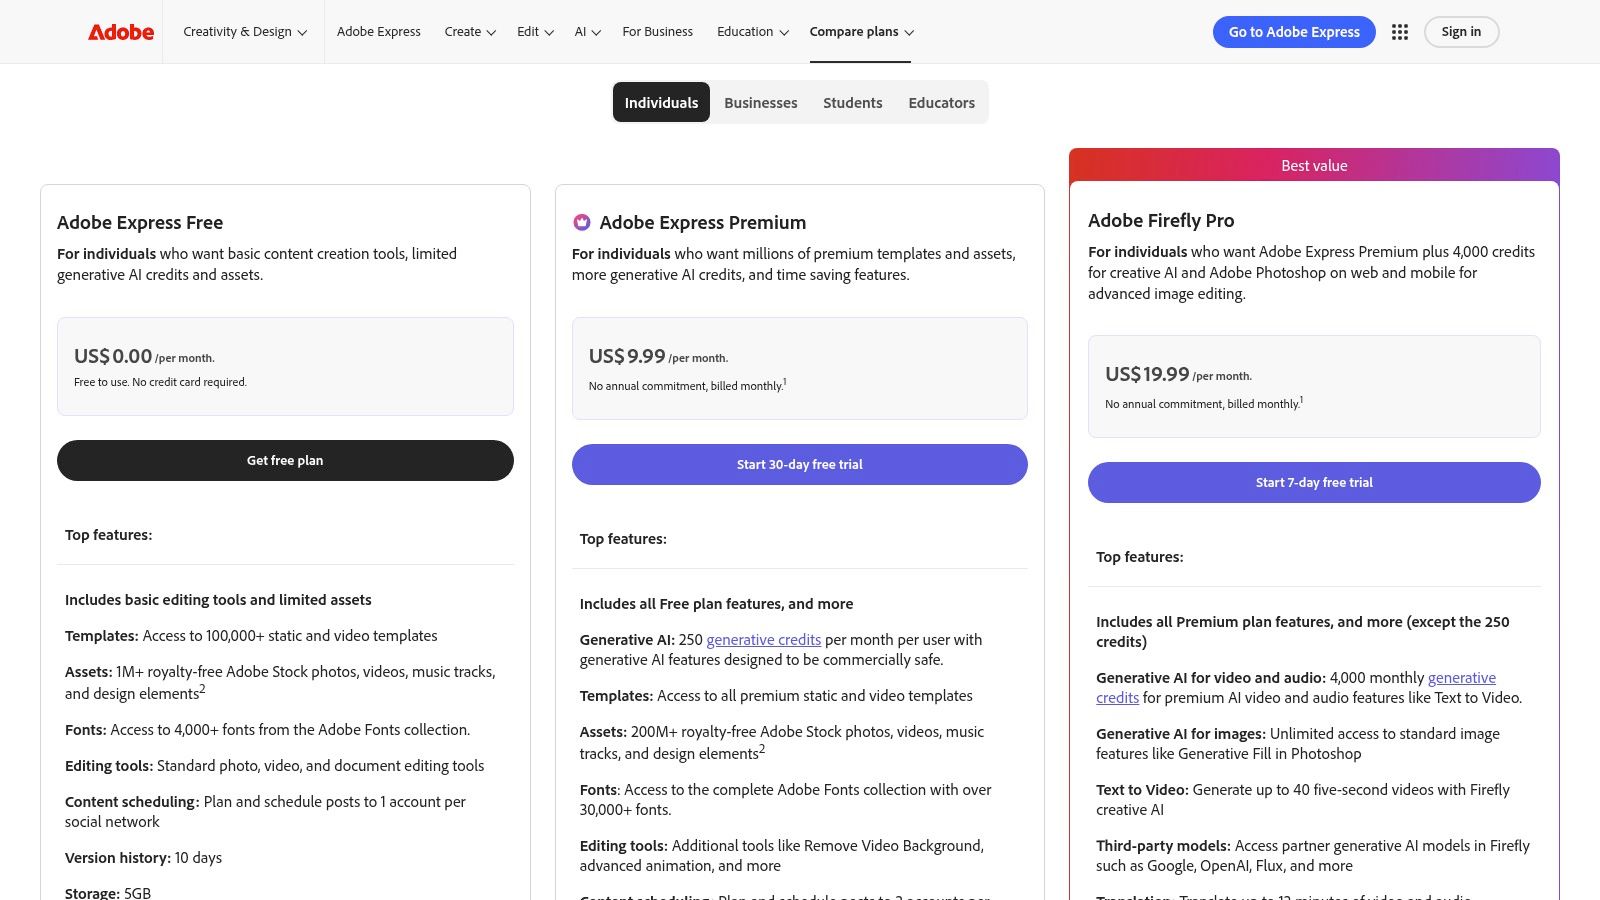
3. Adobe Express
As a key part of Adobe’s creative suite, Adobe Express offers a streamlined, accessible design platform perfect for creating infographics. It bridges the gap between complex professional tools like Illustrator and the need for quick, high-quality visuals. This makes it one of the best tools for creating infographics, especially for marketers, small business owners, and creators already familiar with the Adobe ecosystem who need to produce on-brand content efficiently.
Adobe Express stands out by integrating the power of Adobe's massive asset libraries directly into a user-friendly, template-driven workflow. Its Premium plan grants access to over 200 million royalty-free Adobe Stock assets, including photos, videos, and music. This vast collection, combined with thousands of professionally designed infographic templates and generative AI credits, provides a comprehensive toolkit for crafting compelling visual stories for social media, presentations, and web content.
Key Features and Pricing
The platform’s features are built for modern content creation, combining design, asset management, and scheduling. The Brand Kit allows for easy application of logos, fonts, and colors to maintain consistency. Users can also leverage generative AI to create unique images and text effects. For those looking to create infographics with a specific aesthetic, you can explore ideas for a muted color palette that can be easily applied within the tool.
Free Plan: Includes thousands of templates, a limited collection of Adobe Stock assets, and basic editing tools.
Premium Plan: Unlocks the entire library of 200M+ Adobe Stock assets, 100K+ premium templates, Brand Kit features, and 250 generative credits per month.
Teams Plan: Adds an admin console, 1TB of pooled storage per user, and extended version history for enhanced collaboration.
Pros and Cons
Adobe Express excels at providing a premium asset library and robust brand management features at an accessible price point. Its seamless integration with Photoshop and Illustrator allows for a flexible workflow where users can start a design in Express and send it to a more advanced tool for refinement.
Pros:
Massive library of high-quality Adobe Stock assets and templates.
Strong integration with the professional Adobe Creative Cloud suite.
Excellent brand management tools for maintaining visual consistency.
Cons:
Advanced data visualization and charting tools are less robust than specialized software.
Some key features may be limited to the desktop application.
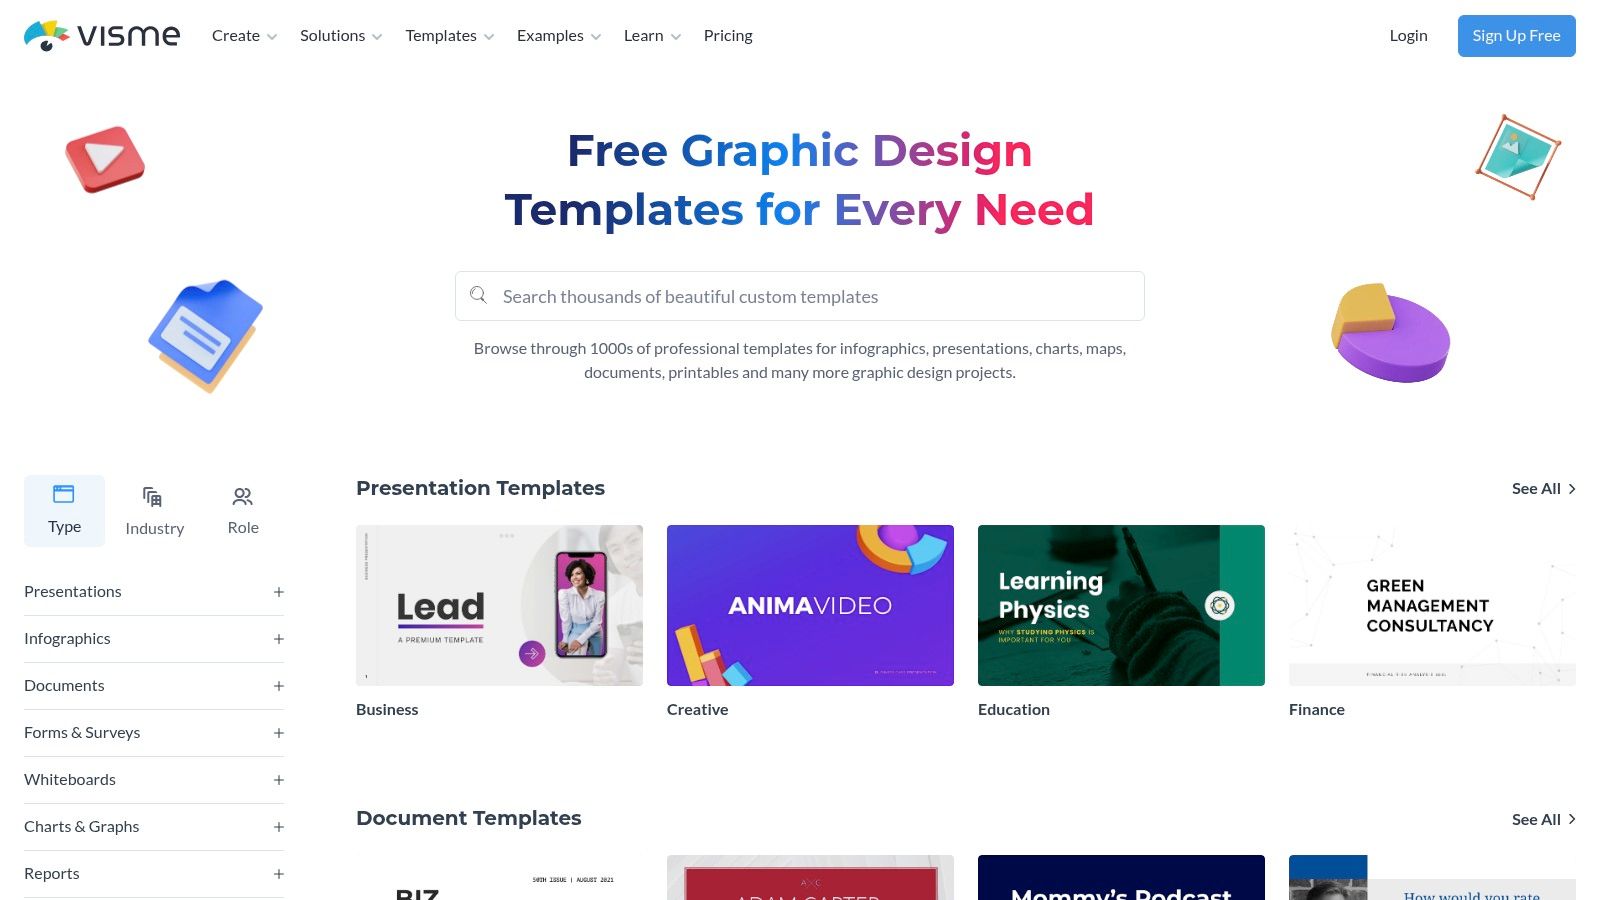
4. Visme
Visme positions itself as an all-in-one visual content platform, extending far beyond static images into the realm of interactive presentations and data visualizations. It serves as a powerful tool for creating infographics, especially for marketers and businesses that need to transform complex data into engaging, interactive narratives. The platform’s strength lies in its ability to combine design flexibility with robust data widgets, making it a go-to for reports, presentations, and web-based graphics.
Unlike simpler tools focused solely on social media templates, Visme is built for more comprehensive projects. It empowers users to create professional, data-rich infographics with a library of over 1,000 templates, charts, and interactive maps. This focus on interactivity and data storytelling makes it one of the best tools for creating infographics meant for websites, business intelligence dashboards, and detailed reports.
Key Features and Pricing
Visme’s features are designed to handle both design and data. Its editor includes a wide range of data visualization tools, allowing you to create custom charts, graphs, and maps that can be animated for added impact. The platform also supports Brand Kits and team collaboration tools like comments and annotations on higher-tier plans, ensuring consistency across all visual assets.
Free Plan: Offers limited access to templates and assets, with Visme branding on all exports.
Starter Plan: Removes branding and provides more storage and access to premium assets.
Pro Plan: Unlocks full template access, Brand Kit, analytics, and advanced download formats.
For Teams: Adds collaboration features, custom sub-domains, and team management controls.
Pros and Cons
Visme excels where data-heavy infographics and interactivity are required. It’s an ideal choice for businesses that need to produce detailed reports, embeddable web graphics, or presentations that can be easily shared and tracked. Its ability to export long infographics as multi-page documents is another standout feature for print or PDF distribution.
Pros:
Excellent data visualization widgets and interactive elements.
Versatile export options for web, print, and presentations.
Strong features for creating branded and professional-looking content.
Cons:
The free plan is quite limited for creating production-ready assets.
The interface can feel more complex than single-purpose design tools.
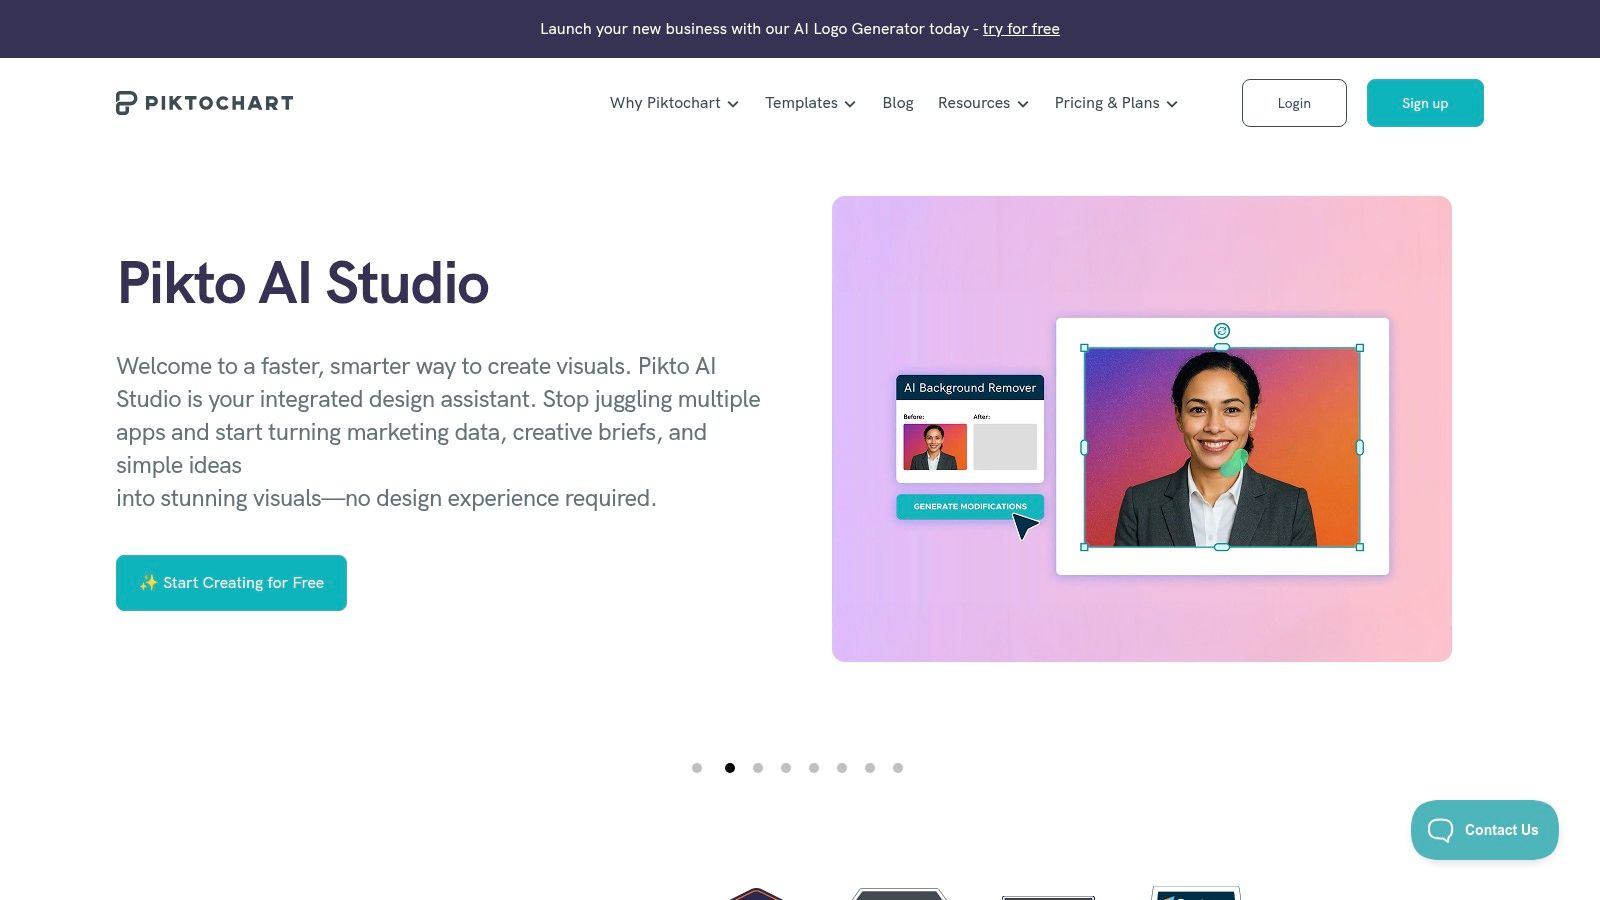
5. Piktochart
A long-standing favorite in the visual content space, Piktochart is one of the best tools for creating infographics, especially for long-form reports and presentations. It strikes a balance between user-friendly design and powerful data visualization, making it a popular choice in education and for small businesses needing to produce detailed, professional visuals without a steep learning curve. The platform is designed to turn complex data into clear, engaging stories.
Piktochart's core strength is its focus on structured, information-rich formats. It offers a well-organized library of templates specifically for infographics, reports, and presentations, guiding users to create visuals that are both beautiful and easy to follow. Its AI-assisted features help accelerate the creation process, while built-in charts and maps allow for straightforward data integration, making it an excellent tool for producing content like thought leadership visuals and annual reports.
Key Features and Pricing
Piktochart’s feature set is geared toward efficient production and brand alignment. The platform supports brand asset integration, allowing teams to upload logos, fonts, and custom color palettes to maintain consistency. Team workspaces and password-protected sharing options on higher tiers facilitate secure collaboration and distribution.
Free Plan: Offers access to a basic set of templates and design assets with limited downloads and Piktochart branding.
Pro Plan: Unlocks premium templates, removes watermarks, provides 100GB of storage, and includes AI credits.
Business Plan: Adds custom brand assets, team collaboration features, and advanced export options like PPTX format.
Pros and Cons
Piktochart excels at simplifying the process of creating data-heavy, long-form infographics. Its structured editor and specialized templates make it ideal for marketing reports, educational materials, and internal communications where clarity and professionalism are paramount.
Pros:
Intuitive layout and design process for long infographics.
Strong brand control and advanced export options on the Business tier.
Good selection of built-in charts and maps for data storytelling.
Cons:
The free plan has significant limitations on downloads and features.
Lacks the advanced data customization found in dedicated business intelligence tools.
6. Venngage
Venngage carves out a specific niche as one of the best tools for creating infographics geared toward business communications. It provides a robust, template-driven platform that empowers professionals to transform complex data and processes into polished, digestible visuals. The tool is particularly well-suited for creating reports, presentations, and internal documentation where clarity and professionalism are paramount.
Its primary strength lies in its focus on business-centric applications. Venngage offers a vast library of templates designed for corporate use cases, such as project timelines, marketing reports, HR processes, and client proposals. This specialization makes it a go-to resource for teams needing to produce stakeholder-ready visuals quickly, with features like brand kits and team collaboration ensuring consistency and efficiency across an organization.
Key Features and Pricing
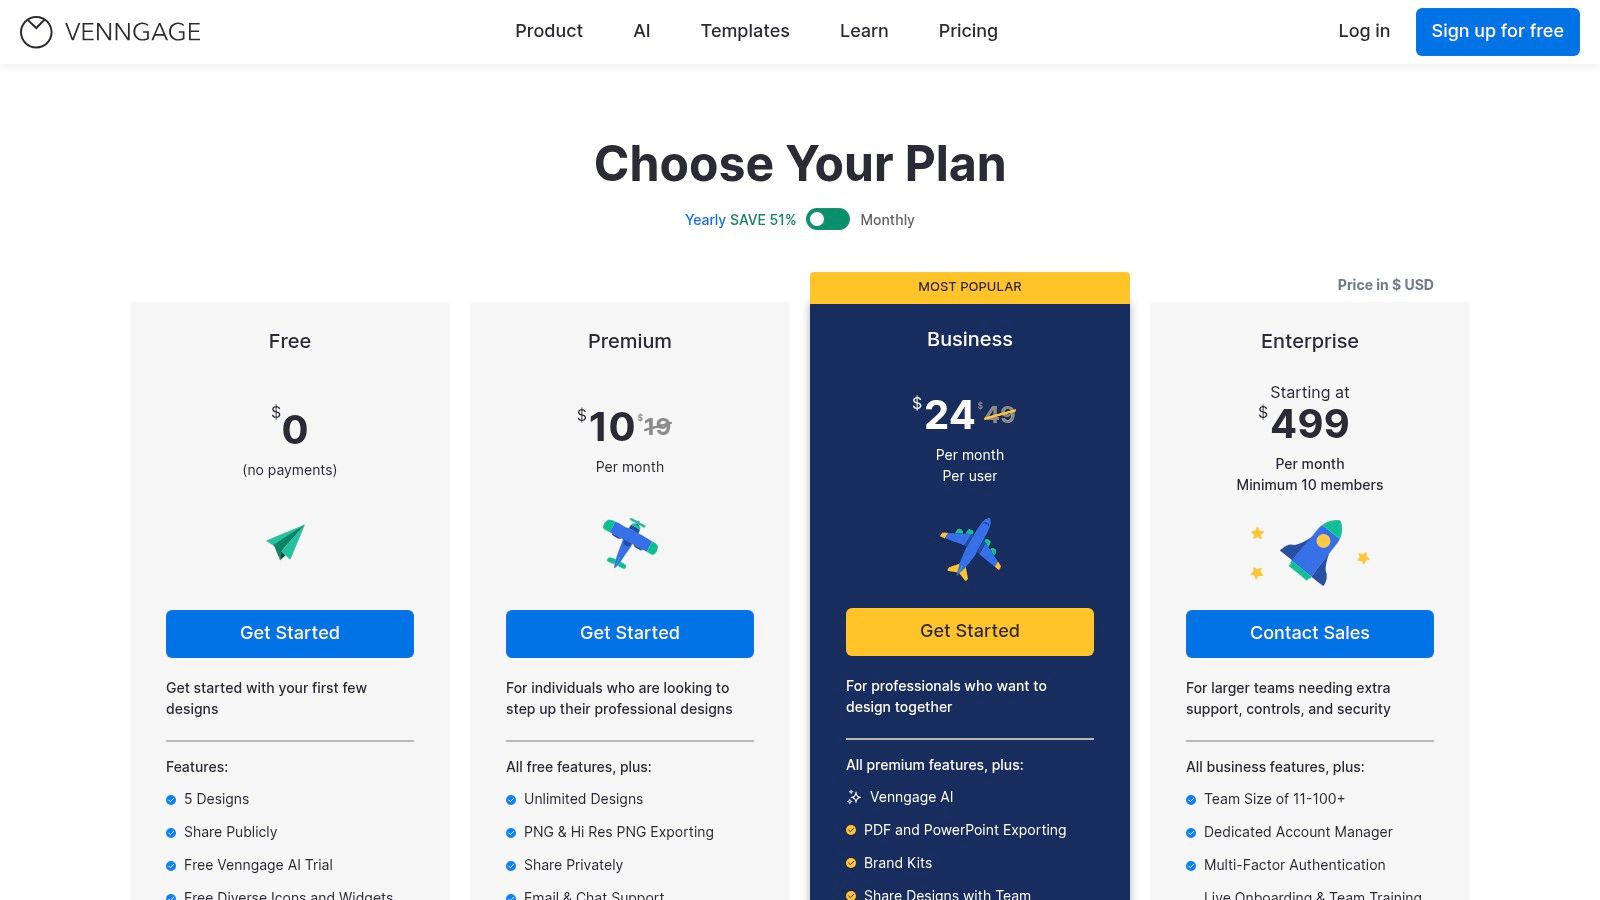
Venngage’s feature set is designed for professional output and brand management. The Business Brand Kit enables users to apply company logos, fonts, and color palettes with a single click. It also offers versatile export options, allowing users to download infographics as high-quality PNGs, PDFs, and even editable PowerPoint files, which is ideal for integrating visuals into presentations.
Free Plan: Offers basic access with a limited number of templates and Venngage branding on exports.
Premium Plan: Unlocks premium templates, high-res exports (PNG and PDF), and email/chat support for individual users.
Business Plan: Adds the Brand Kit, team collaboration features, PowerPoint exports, and live training sessions.
Enterprise Plan: Provides advanced security, dedicated account management, and multi-team controls.
Pros and Cons
Venngage excels at helping businesses create data-rich, professional-looking infographics without requiring advanced design skills. Its structured templates and business-focused features streamline the creation of materials for reports, meetings, and training.
Pros:
Excellent selection of business-oriented templates for reports and processes.
Versatile export options including PDF and interactive PowerPoint.
Strong brand management and team collaboration tools on business tiers.
Cons:
The free plan is quite limited, with heavy branding on outputs.
Per-seat pricing on team plans can become costly for larger organizations.
7. Infogram
For those whose primary goal is data storytelling, Infogram stands out as one of the best tools for creating infographics centered on complex information. Acquired by Prezi, this platform specializes in turning numbers and statistics into engaging, interactive, and embeddable visual content. It is the ideal choice for journalists, marketers, and analysts who need to present data-heavy narratives on websites, reports, or dashboards with clarity and impact.
Infogram’s core strength is its powerful data visualization engine. It moves beyond static charts to offer over 37 interactive chart types, including detailed maps and live data integrations on higher-tier plans. This allows creators to build dynamic infographics that audiences can explore. Instead of just presenting a fact, you can let users hover over data points, switch between datasets, and dive deeper into the information, making it perfect for embedding in online articles or business intelligence dashboards.
Key Features and Pricing
Infogram is built to handle data efficiently and professionally. Key features include the ability to connect to live data sources like Google Sheets or JSON feeds, ensuring your embedded infographics are always up to date. The platform also provides engagement analytics and tracking links to measure how audiences interact with your visuals.
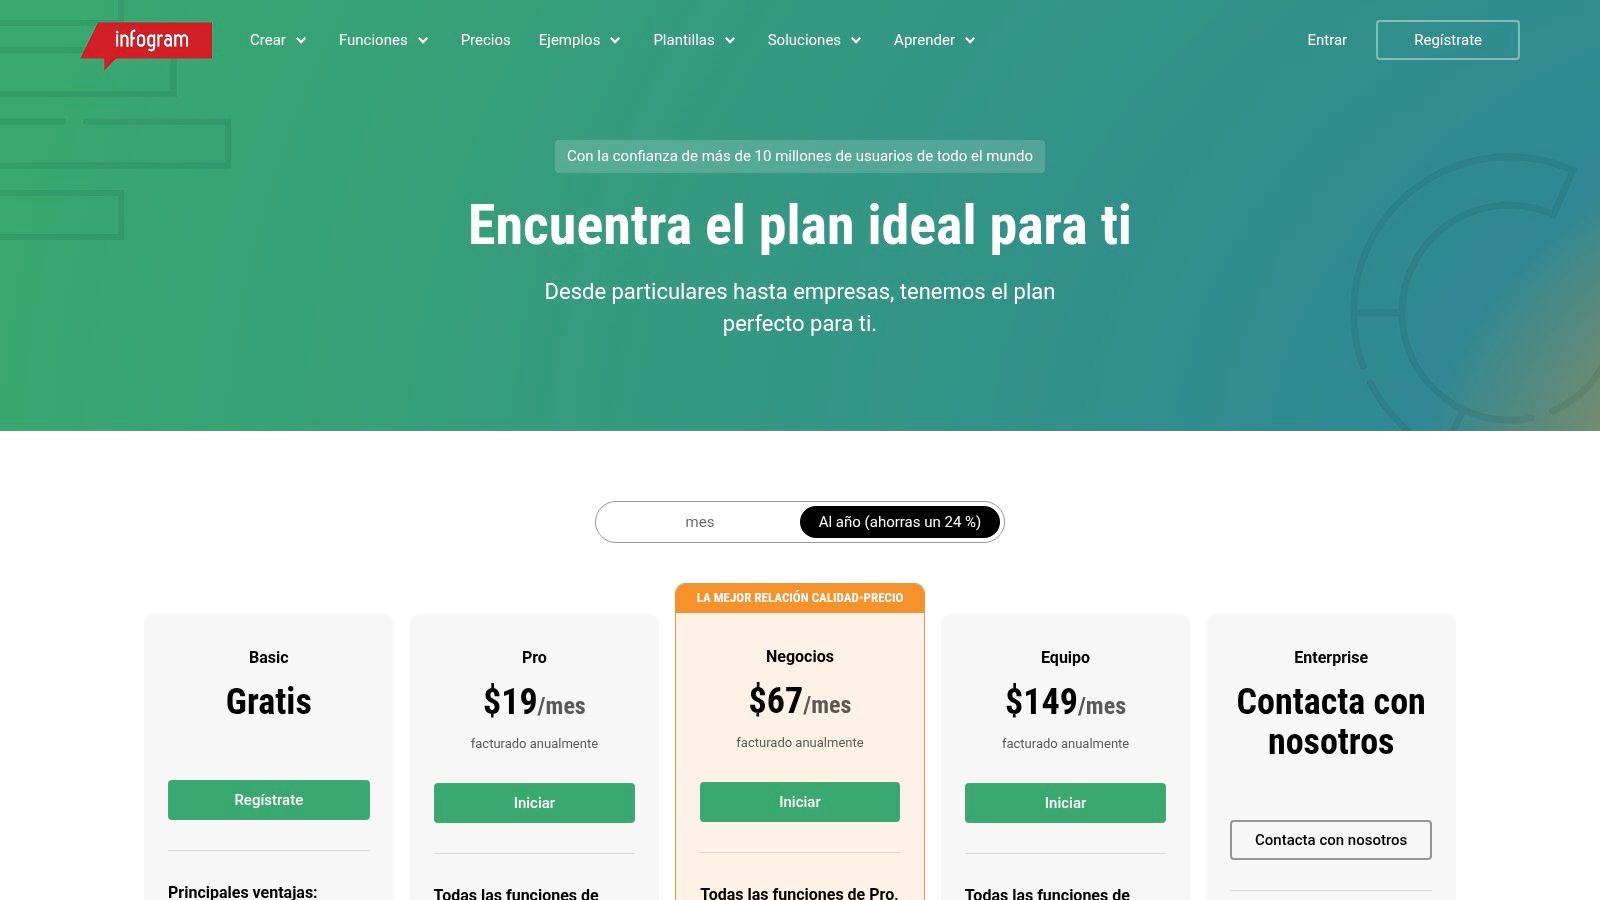
Free Plan: Allows creation of up to 10 projects with basic chart types and public sharing.
Pro Plan: Adds premium templates, over 100 project types, and image/GIF downloads.
Business Plan: Unlocks the full library of 37+ interactive charts and maps, plus privacy controls.
Team Plan: Introduces real-time collaboration, a shared asset library, and engagement analytics.
Enterprise Plan: Offers live data connections, advanced security, and dedicated support.
Pros and Cons
Infogram excels where other design-focused tools fall short: deep data integration. It's the go-to solution when the visual needs to be more than just illustrative; it needs to be an interactive data exploration tool. This makes it invaluable for digital publications, annual reports, and data-driven marketing content.
Pros:
Excellent for data-heavy, interactive infographics and reports.
Robust map library and powerful live-data connectors on higher tiers.
Generates easily embeddable HTML infographics for websites.
Cons:
Has a steeper learning curve for advanced data features compared to simpler tools.
Many of its most powerful capabilities are gated behind higher-tier subscription plans.
8. Figma (and FigJam)
For design professionals and teams demanding pixel-perfect control, Figma is less of a template-based tool and more of a powerful, collaborative design platform where any infographic is possible. It is the go-to for creating bespoke, on-brand visual systems from scratch. While it has a steeper learning curve than drag-and-drop editors, its flexibility is unparalleled for integrating infographics directly into established design systems and brand guidelines.
Figma's strength lies in its collaborative nature and extensible ecosystem. Design teams can work together in real-time on the same file, leveraging shared component libraries to ensure consistency across all visual assets. The community hub provides access to countless free templates, UI kits, and plugins specifically for creating charts and data visualizations, extending its core functionality to meet the needs of complex infographic projects.
Key Features and Pricing
Figma’s features are built for professional design workflows. Component Libraries and Variables allow for the creation of reusable infographic elements that can be updated globally, ensuring brand consistency. FigJam, its online whiteboard tool, is perfect for brainstorming infographic structures and data flows collaboratively before moving into the high-fidelity design phase.
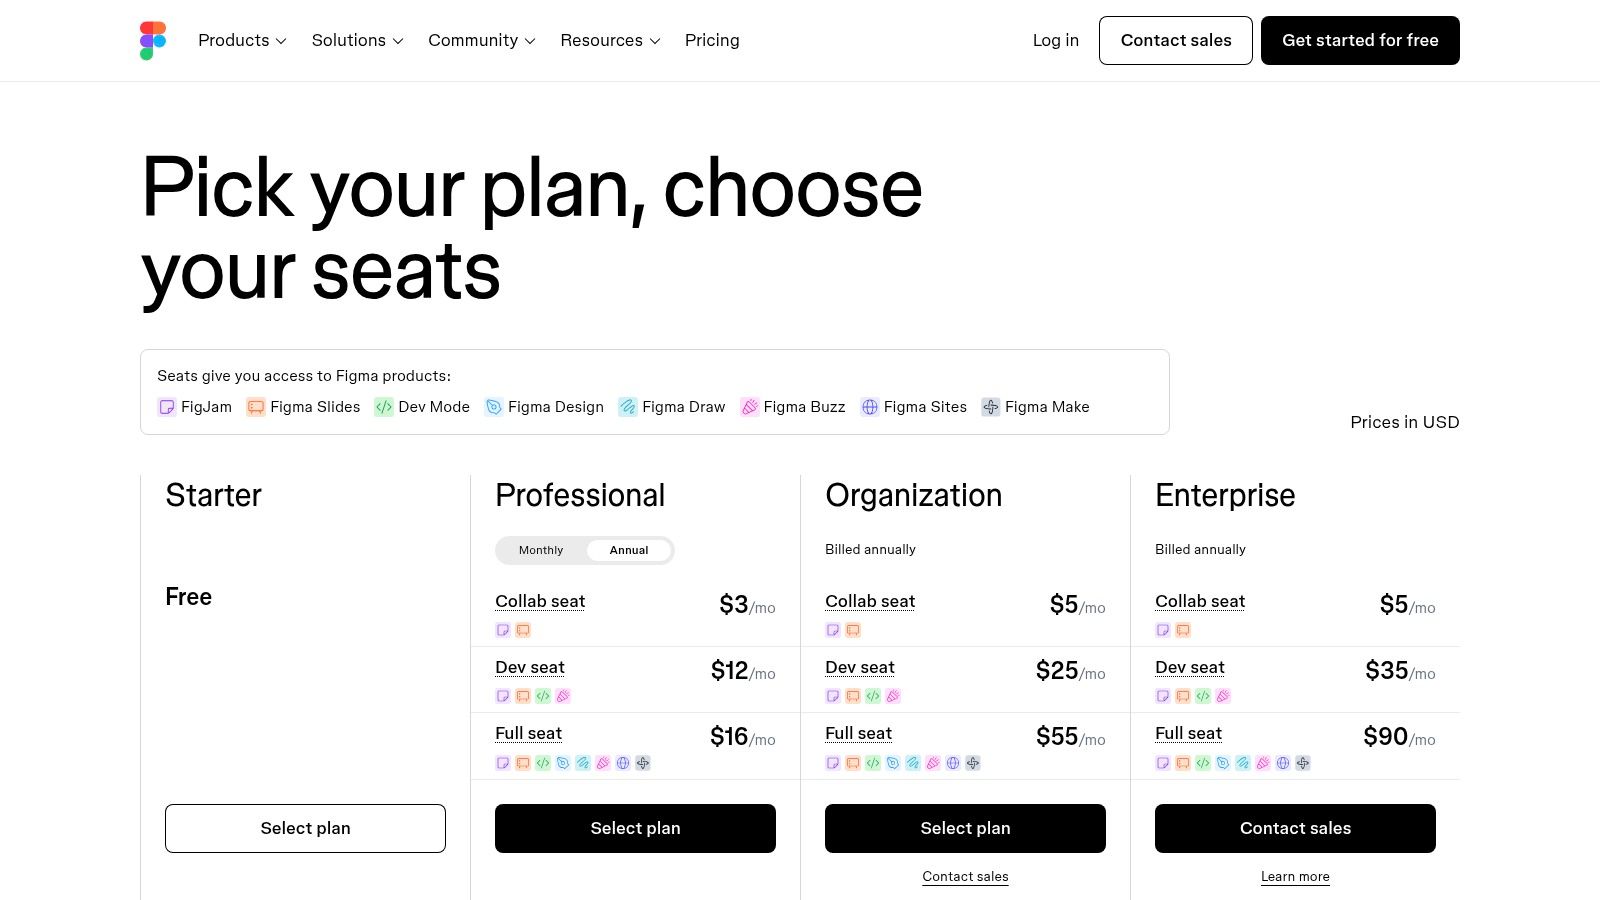
Free Plan: Includes 3 Figma and 3 FigJam files, unlimited personal files, and full access to plugins and templates.
Professional: Unlocks unlimited files, shared and private projects, and advanced team features.
Organization: Adds centralized design systems, private plugins, and advanced security.
Pros and Cons
Figma is one of the best tools for creating infographics when precision and brand integration are top priorities. It's ideal for design agencies, in-house creative teams, and anyone who needs to produce custom, high-fidelity visuals that align perfectly with a mature brand identity.
Pros:
Ultimate customization and control for bespoke infographics.
Powerful real-time collaboration and versioning for teams.
Extensive plugin library for advanced charts and data handling.
Cons:
Steeper learning curve; less guided than template-first platforms.
Setup is more time-consuming for quick, one-off projects.
Some of the best plugins for advanced data visualization are paid add-ons.
9. Microsoft PowerPoint (Microsoft 365)
For teams deeply integrated into the Microsoft 365 ecosystem, PowerPoint offers a familiar and surprisingly capable path for creating infographics. While not a dedicated design platform, it leverages the tools millions of users already know, eliminating the need to learn new software. It’s an ideal solution for professionals who need to produce clear, printable, or presentation-ready infographics without straying from their existing workflows.
PowerPoint's strength lies in its accessibility and integration. Users can quickly adapt pre-existing presentation elements or build from scratch using a robust set of native tools. Its SmartArt graphics, customizable shapes, and built-in charting engine provide a solid foundation for visualizing processes, timelines, and simple data sets, making it one of the best tools for creating infographics within a corporate environment.
Key Features and Pricing
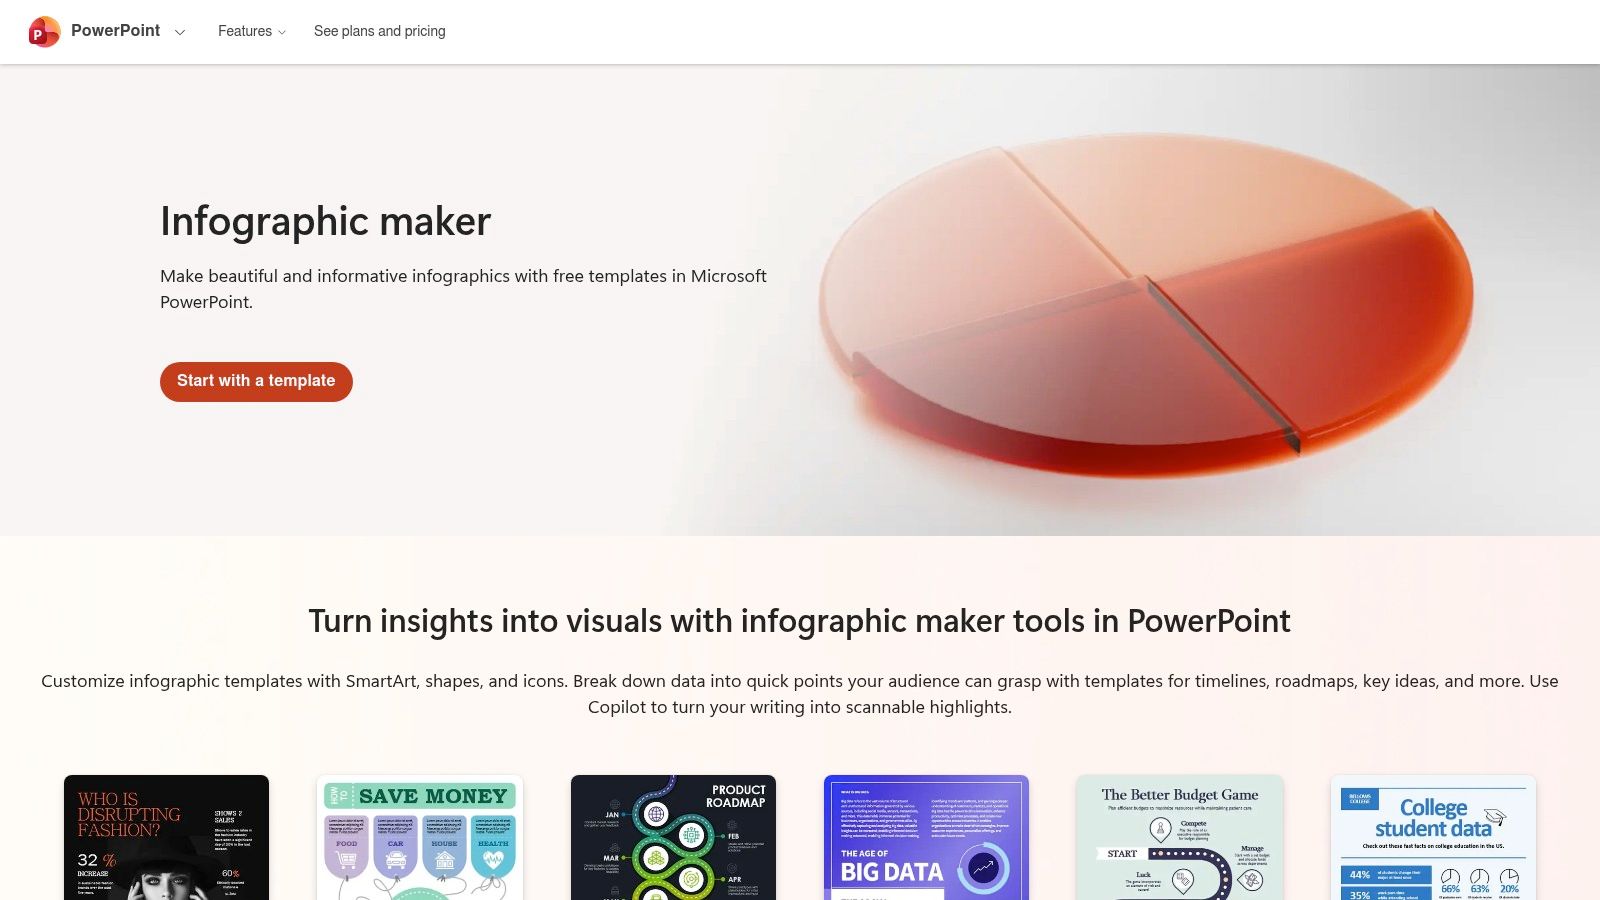
The platform includes a growing library of dedicated infographic templates for specific use cases like roadmaps and organizational charts. For users with eligible subscriptions, the integrated Copilot AI can generate entire infographics based on prompts, complete with brand-aligned color schemes, which drastically speeds up the initial creation process.
Infographic Templates: Ready-made layouts for timelines, processes, and posters.
SmartArt & Charts: Easily create visual hierarchies and data representations.
Copilot AI: Generates infographic structures and designs based on user input (requires an eligible Microsoft 365 subscription).
Microsoft 365 Integration: Seamlessly export to PDF, present directly, or embed in other Office documents.
Pros and Cons
PowerPoint is the path of least resistance for organizations already invested in Microsoft 365. It excels at producing professional, straightforward infographics for internal reports, client presentations, and printable handouts where brand consistency and clarity are more important than cutting-edge design trends.
Pros:
No new software or learning curve for existing Microsoft 365 users.
Excellent for creating printable and presentation-ready outputs.
Strong integration with other Office suite applications.
Cons:
Template selection is less modern and extensive than specialized design tools.
Advanced AI features like Copilot depend on specific subscription tiers and may have usage limits.
10. Envato Elements
Unlike a dedicated infographic maker, Envato Elements is a massive subscription-based marketplace for creative assets. It serves as an invaluable resource library for designers, marketers, and agencies who need a steady stream of high-quality templates to use in other editing software. Instead of creating from scratch, users can download professionally designed infographic templates for tools like Adobe Illustrator, Photoshop, PowerPoint, Keynote, and even Canva.
Its core value lies in offering unlimited downloads from a library of over 26 million assets under a simple commercial license. For teams or individuals producing a high volume of visual content, Envato Elements acts as a comprehensive toolbox. It provides the foundational templates, icons, fonts, and stock photos, which can then be customized in a user's preferred design application, making it one of the most flexible resources for creating infographics.

Key Features and Pricing
The platform is built around an all-access subscription model, providing significant value for heavy users. The simple commercial license covers most common business uses, from marketing campaigns to internal presentations, taking the guesswork out of asset rights.
Individual Plan: A single monthly or annual fee grants one person unlimited access to the entire library of templates, stock photos, fonts, and more.
Teams Plan: Offers the same unlimited downloads but adds team management features like centralized billing and the ability to share downloaded assets among members.
Enterprise Plan: Custom solutions for larger organizations needing tailored licensing and support.
Pros and Cons
Envato Elements is best for creatives who are comfortable working within professional design software and need a constant supply of diverse templates. It’s an asset engine rather than a self-contained editor, empowering users to produce unique results with pre-built starting points.
Pros:
Extremely cost-effective for high-volume template and asset users.
Broad compatibility with various design tools (Adobe, Microsoft Office, Canva).
A single, straightforward license covers most commercial needs.
Cons:
The quality of templates can vary, requiring users to curate the best items.
An active subscription is needed to license assets for new projects.
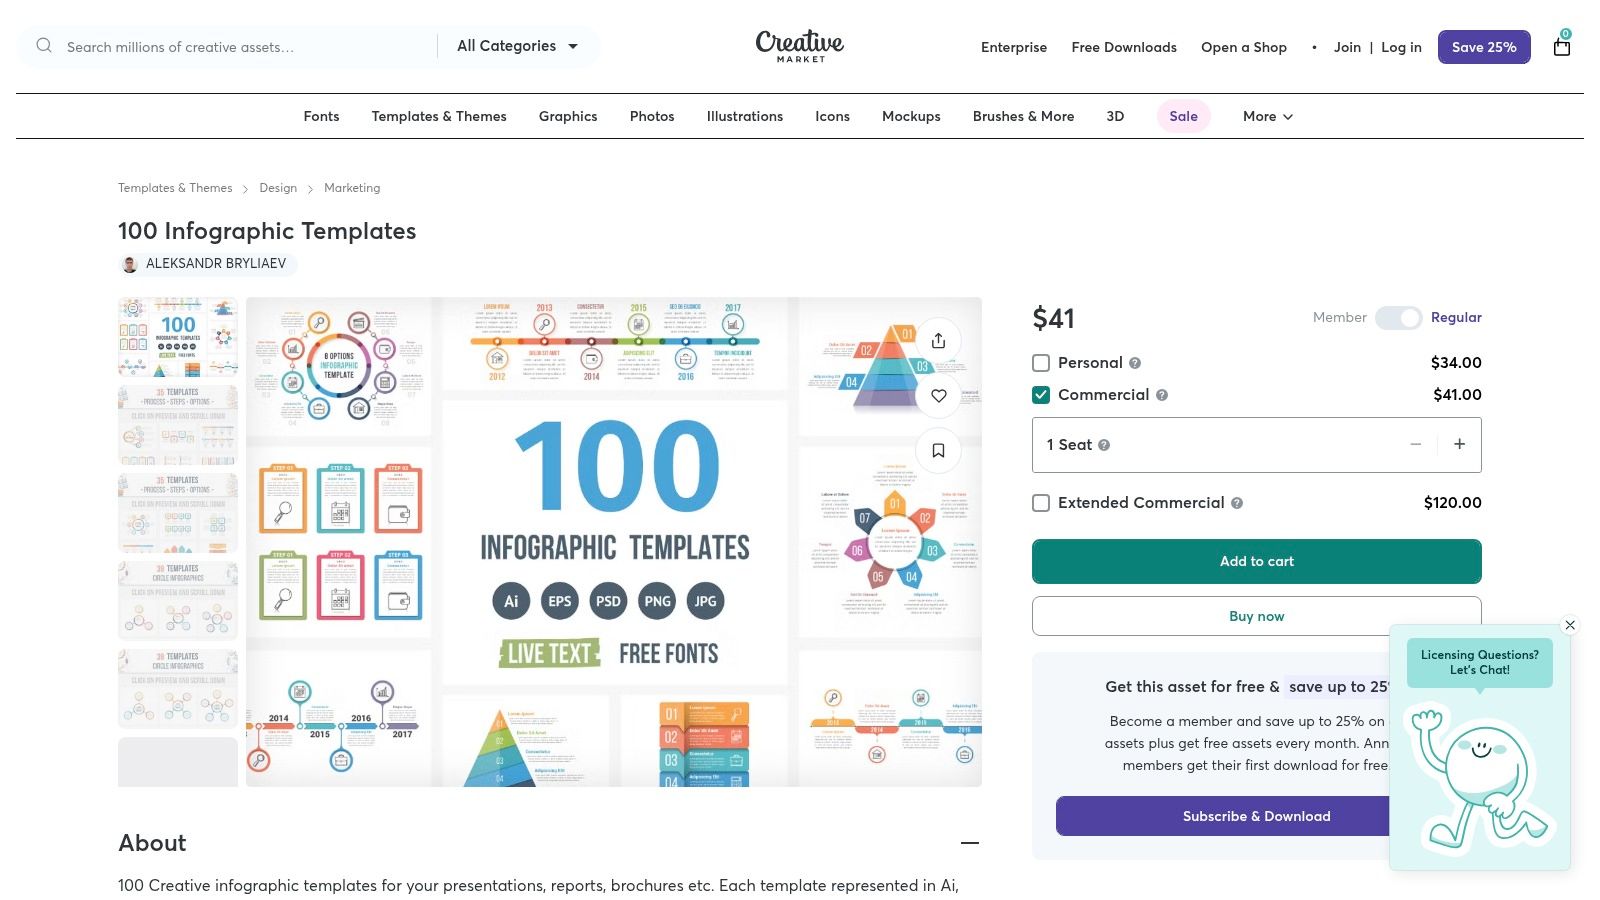
11. Creative Market
For creators who prefer to buy assets a la carte rather than commit to a subscription, Creative Market is a vast marketplace of design resources. It isn't a tool itself but a massive library where you can purchase high-quality, professionally designed infographic templates from thousands of independent creators. This makes it one of the best tools for creating infographics when you need a unique style or a one-off asset pack for a specific project.
The platform excels in variety, offering everything from vector icon sets and data visualization kits to complete infographic bundles compatible with Adobe Illustrator, Photoshop, PowerPoint, and even Canva. This approach is ideal for agencies or freelancers who need to match a specific client aesthetic or for small businesses that only need to produce infographics occasionally and want to avoid another recurring monthly fee.
Key Features and Pricing
Creative Market’s model is built around individual purchases, giving you total control over your spending. The platform provides thousands of infographic bundles and slide packs, ensuring you can find a style that fits your brand.
A-la-carte Purchasing: Pay only for the templates and assets you need. There is no mandatory monthly subscription.
Vast Selection: Source infographic templates, icons, fonts, and illustrations from a global community of designers.
Clear Licensing: Straightforward Personal, Commercial, and Extended Commercial licenses are available for each asset, clarifying usage rights.
Pros and Cons
Creative Market is the perfect solution for sourcing specific, high-quality design assets without long-term commitments. It's best suited for designers comfortable working in professional software or those who want to upload unique templates into tools like Canva. The sheer diversity of styles available is unmatched by any single platform.
Pros:
Incredible stylistic variety from independent designers worldwide.
Buy exactly what you need with no subscription required.
Assets are often compatible with multiple professional design applications.
Cons:
Quality and file compatibility can vary between sellers, so it's vital to read descriptions carefully.
The total cost can become high if you need to purchase numerous assets frequently.
12. Marq (formerly Lucidpress)
Marq, formerly known as Lucidpress, is a brand templating platform designed for organizations that need to scale content creation without sacrificing brand integrity. It’s less of a free-form design tool and more of a structured environment where teams can produce on-brand collateral, including infographics, consistently and efficiently. This makes it one of the best tools for creating infographics in corporate settings where maintaining brand guidelines is non-negotiable.
The core strength of Marq lies in its powerful brand-locking features. Administrators can create locked templates where key elements like logos, brand colors, and fonts are fixed, while other areas remain editable for team members. This allows non-designers across an organization to generate professional infographics that are always on-brand, dramatically reducing the risk of inconsistent visuals and freeing up creative teams from repetitive requests.
Key Features and Pricing
Marq’s features are built around governance, scalability, and brand control. Data automation is a standout capability, allowing users to connect templates to data sources like Google Sheets or CSV files to automatically populate infographics with updated information. This is ideal for generating recurring reports or personalizing visuals at scale.
Free Plan: Offers basic functionality for individuals to try out the editor.
Pro Plan: Aimed at individuals needing more features, including premium templates and brand asset management.
Team & Business Plans: Unlock the core brand templating features, including locked templates, advanced user roles, approval workflows, and data automation.
Pros and Cons
Marq excels in structured environments where brand consistency is paramount. It empowers marketing, sales, and HR teams to create their own materials within safe, pre-approved guardrails. This system streamlines content production and ensures every infographic reinforces the brand's visual identity.
Pros:
Excellent for maintaining brand consistency across large teams.
Reduces design bottlenecks with locked, repeatable templates.
Powerful data automation features for scalable content.
Cons:
May be overly complex and expensive for solo creators or small businesses.
Its most valuable features are reserved for higher-tier Team and Business plans.
Top 12 Infographic Tools Comparison
| Tool | Core features | UX / Quality (★) | Price / Value (💰) | Target audience (👥) | Unique selling points (✨) |
|---|---|---|---|---|---|
| Postbae 🏆 | Hands-off AI agent that auto-generates visual social media posts (carousels, listicles, infographics) | ★★★★★ | 💰 Starts at $30/mo | 👥 Small businesses, social managers, agencies, creators | ✨ End-to-end automation with no prompts needed; creates actual graphics, not just text |
| Canva | Template library, drag‑and‑drop editor, AI tools, brand kit | ★★★★★ | 💰 Freemium → Pro/Business | 👥 Solo creators → teams & enterprises | ✨ Massive assets + easy brand controls |
| Adobe Express | Templates + Adobe Stock, scheduling, desktop & mobile apps | ★★★★☆ | 💰 Freemium → Premium | 👥 Creators, social teams, Adobe users | ✨ Adobe ecosystem + stock assets + scheduling |
| Visme | Infographic templates, interactive widgets, export to web/print | ★★★★☆ | 💰 Tiered (free limited) | 👥 Marketers, educators, presenters | ✨ Interactivity & animation for data storytelling |
| Piktochart | Long-form infographics, built-in charts/maps, AI credits | ★★★★ | 💰 Freemium → Business | 👥 Educators, SMBs, report creators | ✨ Easy long-form layouts & brand export options |
| Venngage | Template-driven infographics, business export (PDF/PPT), brand kit | ★★★★ | 💰 Tiered pricing | 👥 Corporate comms, marketing teams | ✨ Business-friendly templates & exports |
| Infogram | Interactive charts/maps, live-data connections, embeddable outputs | ★★★★ | 💰 Paid tiers for live data | 👥 Data teams, publishers, dashboards | ✨ Live-data embeds & rich chart types |
| Figma (and FigJam) | Pixel control, plugins for charts, real-time collaboration | ★★★★★ | 💰 Free → Paid teams | 👥 Design teams, product teams | ✨ Design-system integration & multiuser editing |
| Microsoft PowerPoint (M365) | Templates, SmartArt, charts, Copilot-assisted creation | ★★★★ | 💰 Included in M365 subscription | 👥 Teams already on Microsoft 365, presenters | ✨ Familiar workflow + Copilot for quick infographics |
| Envato Elements | Unlimited template downloads, fonts, icons, stock assets | ★★★★ | 💰 Subscription (unlimited) | 👥 Heavy template users, agencies | ✨ Broad file-type templates + commercial license |
| Creative Market | A‑la‑carte infographic templates and asset packs | ★★★★ | 💰 One‑off purchases | 👥 Designers needing specific styles | ✨ One-off buys from independent creators, stylistic variety |
| Marq (formerly Lucidpress) | Locked brand templates, approvals, data automation, SSO | ★★★★ | 💰 Team/enterprise pricing | 👥 Enterprise & brand teams | ✨ Brand governance, approval workflows, scalable templates |
Choosing the Right Tool to Bring Your Data to Life
Navigating the landscape of infographic creation tools can feel overwhelming, but the journey to finding the perfect fit is an investment in your brand's storytelling power. We've explored a wide spectrum of platforms, from fully automated AI agents to robust manual design suites and specialized data visualization powerhouses. The central takeaway is this: the best tool for creating infographics is not a one-size-fits-all answer but rather a direct reflection of your specific goals, resources, and workflow preferences.
Your final decision should hinge on a clear understanding of your primary objective. Are you a busy social media manager or small business owner aiming to consistently publish authority-building visual content without spending hours on design? Or are you a data analyst who needs to transform complex datasets into interactive, embeddable charts for reports and articles? Each of these use cases points to a different optimal solution.
Key Factors to Guide Your Selection
Before committing to a subscription, consider these crucial factors that will ultimately determine your success with any given platform:
Time and Automation: The most significant variable is your available time. If your primary bottleneck is the manual effort of ideation, research, and design, then an automation-first tool is your best bet. A platform like Postbae is designed to eliminate this friction entirely, acting as an AI agent that handles the entire creative process for you. In contrast, tools like Canva and Visme, while powerful, still require a significant hands-on time investment for creation and customization.
Primary Use Case: Pinpoint where your infographics will live. For social media, you need formats optimized for feeds, such as carousels and vertical slideshows. For formal presentations or annual reports, you’ll need tools that excel at traditional long-form infographics and offer high-resolution PDF exports. A social-media-first tool will prioritize templates and layouts proven to perform on platforms like Instagram and LinkedIn, whereas a tool like Infogram is built for embedding interactive charts into websites and digital reports.
Design Skill and Customization Needs: Honestly assess your design confidence. Beginners and non-designers will thrive with template-heavy platforms like Piktochart or Adobe Express that simplify the process. If you have a keen eye for design and require granular control over every element, a more advanced tool like Figma offers unparalleled flexibility. The key is to find a balance; you want enough creative control to align with your brand but not so many options that you face decision paralysis.
Making a Strategic Choice for Your Workflow
Ultimately, the right tool should feel like a natural extension of your content strategy, not another hurdle to overcome. For teams focused on brand consistency at scale, Marq offers robust brand templating features. For individuals needing a quick, one-off design, a template marketplace like Envato Elements might be the most cost-effective solution. To further aid in your selection process, delving into a a comprehensive overview of various content creation tools can provide broader context on how these specialized platforms fit into the larger digital marketing ecosystem.
By evaluating your needs against the core strengths of each tool we've reviewed, you can move forward with confidence. The goal is to empower yourself to communicate visually, turn data into compelling narratives, and consistently capture your audience's attention. Choose the platform that removes the most friction from your path and helps you achieve that goal efficiently and effectively.
Ready to put your social media content creation on autopilot? If your goal is to produce high-quality, educational infographics and visual posts without the manual design work, Postbae is the AI agent built for you. Stop designing and start publishing authority-building content that grows your brand.